
A few weeks ago, New York Community Bancorp (NYCB) was downgraded to below investment grade status. The fears of a continuation of the regional banking crisis have been mounting. Early last week, its stock dropped sharply down, going below $2 per share though it recovered slightly after a $1B capital injection (see Figure 1).
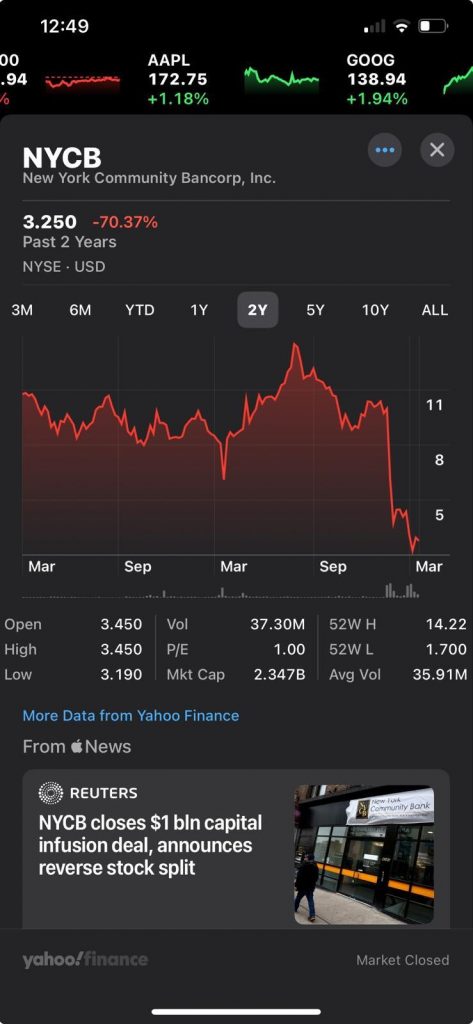
The main reasons for such a dramatic turn after NYCB success during the banking crisis of spring 2023 were listed as a surprise fourth-quarter loss and steeper provisions for loan losses, fears of deposit run-offs despite of high percentage of insured deposits, and “material weaknesses” in the way it reviewed its commercial loans.
So is the $1B capital injection enough to bring NYCB out of the danger zone? We used Straterix’s scenario analysis tools to take a more in-depth look and analyze what might happen to NYCB demand deposits and loan provisions.
We generated a full-range (exhaustive set) of scenarios and analyzed those paths where demand deposits dropped by about 10% (exceeding $1B) or more within a single quarter. See Figure 2.
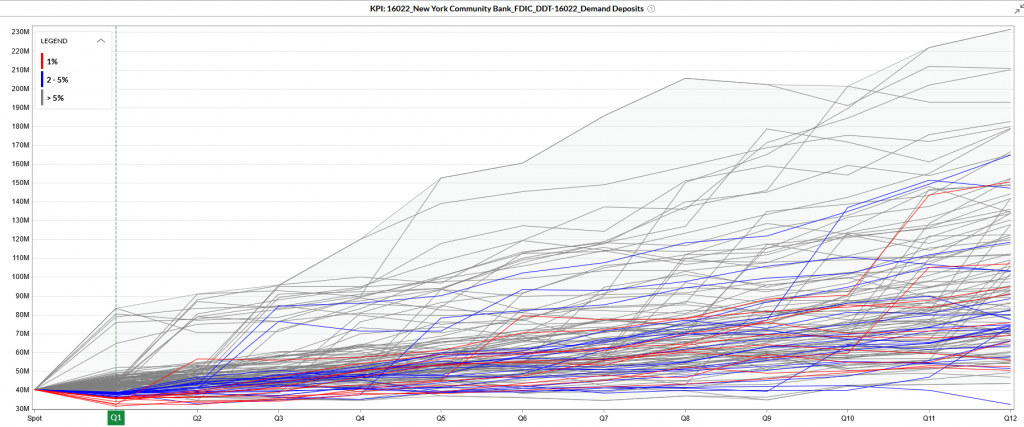
This chart shows that NYCB demand deposits can drop by $1B or more over one quarter with the probability of 6.5% (the blue lines) and by more than $4B with probability of 1% (the red lines). Through this kind of exhaustive reverse scenario analysis, we can analyze other variables on these paths as well. Let’s select scenario #755 and review the market environment characteristics for a 10% deposit decline.
We can see that such a scenario is more severe than the Federal Reserve Bank Severely Adverse Scenario and much more dramatic than the two FRB’s Exploratory scenarios (A and B) – while it’s not unprecedented!
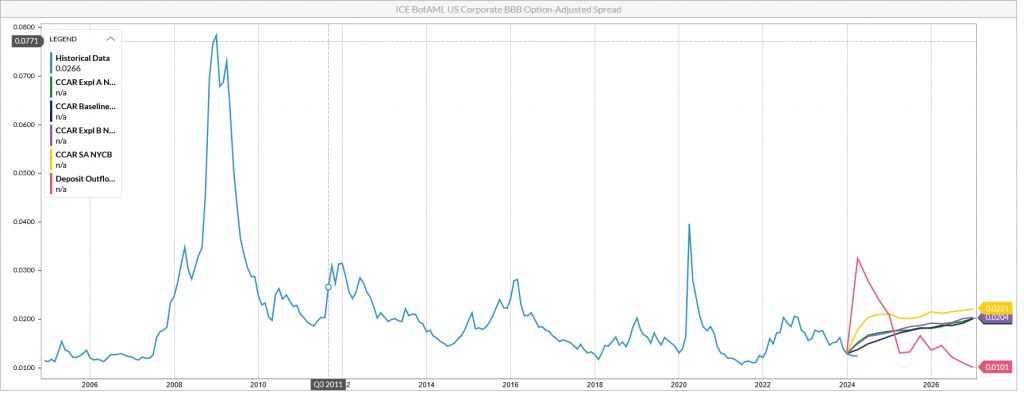
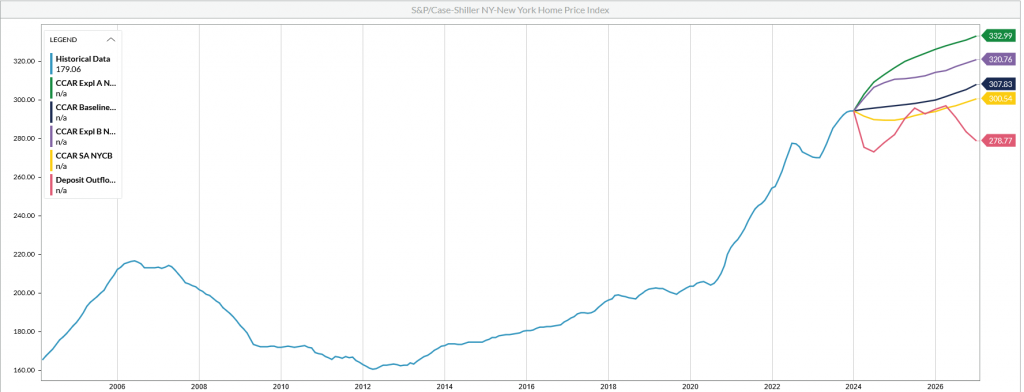
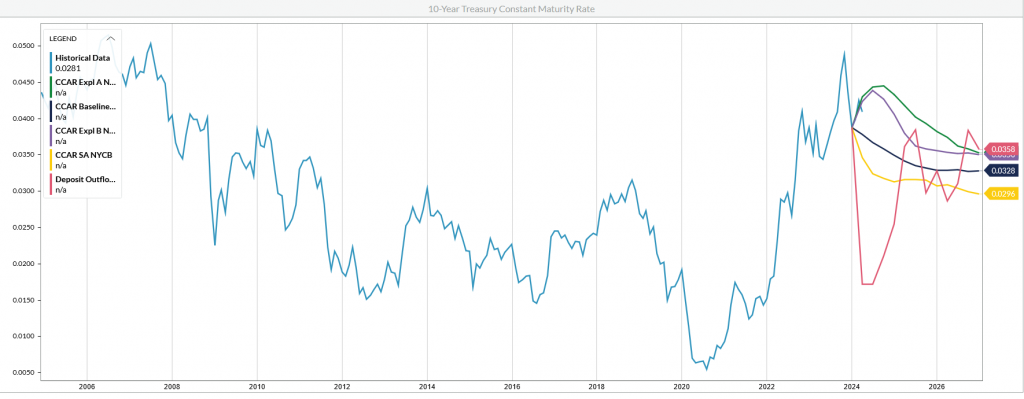
Figures 3-5 show the comparison of these scenarios for the 10-year Treasury rate, BBB-rated spread, and New York (NY) Home Price index.
Figure 3 demonstrates that credit spreads are much more elevated than even FRB’s severely adverse scenario. Yet even more substantial rises in credit spreads were observed during the pandemic and the global financial crisis of 2008.
At the same time, this scenario is not as dramatic as the Federal Reserve Bank’s stress scenarios for commercial real estate (CRE) for the United States (Figure 6).
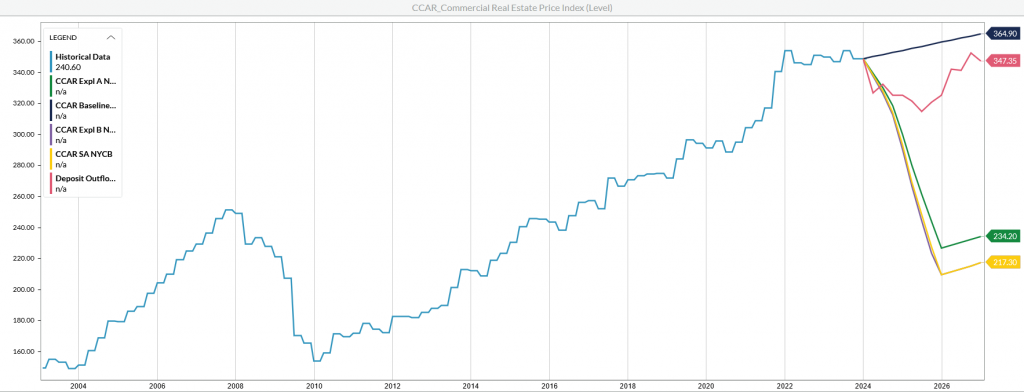
Thus, NYCB’s severe deposit runs are driven by a drop in NY home prices more so than by the overall countrywide CRE levels.
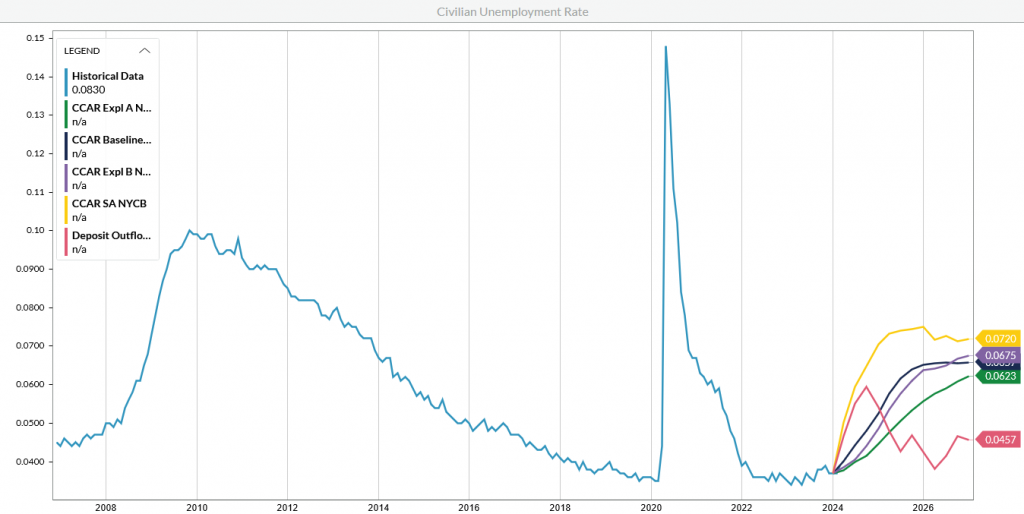
The same type of scenarios will lead to 99th percentile of net charge-offs as shown in Figures 7-8. While losses double within one quarter of the scenario horizon, rates, NY home prices, real GDP as well equity markets go sharply down. At the same time, unemployment increases consistently with the FRB’s CCAR Severely Adverse scenario while BBB-rated spread increases even more drastically.
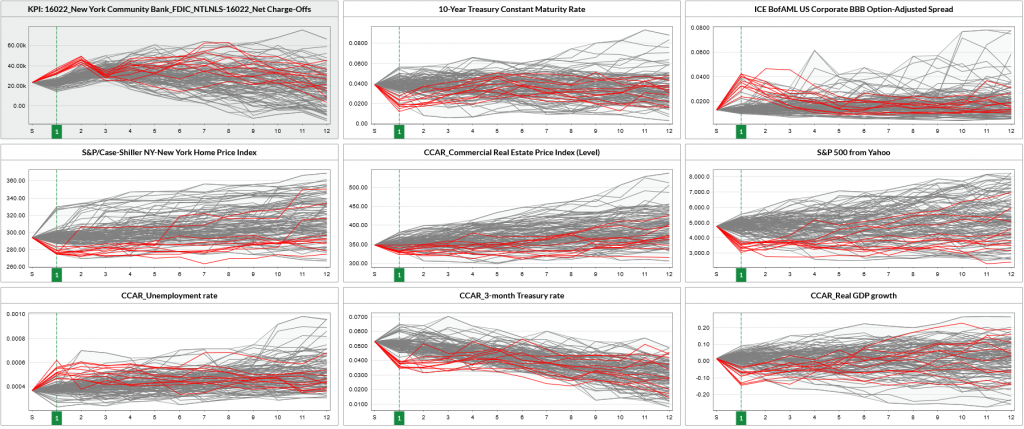
Gray lines in Figure 7 represent all scenario projections while the red lines indicate the scenarios where the charge offs increase substantially (more than 50%) in the first quarter of scenario analysis.
CONCLUSIONS
As seen in the charts above, the idiosyncratic stress scenario for NYCB that was identified by Straterix’s exhaustive reverse scenario analysis is neither unprecedented, nor extreme.
Yet in this scenario, with simultaneous deposit runs and charge-off increases, NYCB might need additional funds to stay afloat. The probability of this outcome is not high, but at 6% it should have the attention of both new and old investors, the bank management, and the supervisors!